Prometheus
Prometheus is an open source monitoring system build around an included time series database to collect lots of metrics. Through the use of exporters a lot of systems can be analyzed. The results are available through a web GUI or CLI querying. Additionally Grafana can be used for better visualization.
Prometheus will pull metrics data from exporter, store it in its internal database can push alerts and is available to be queried by clients like grafana. The service discovery can help to autodetect new systems.
The Prometheus time series database stores the information in time series for each metric with optional labels. The labels are used to store dimensional instantiation of metrics. All values are numerical stored as float64. The metrics can be:
- counter - the value will always increase or be reset to 0
- gauge - single number which can go up and down
- histogram - counts values in configurable buckets
- summary - counts values over a sliding time window
Installation
If available install it through package management:
sudo pacman -S prometheus
sudo apt-get install prometheus
But you can also get it from the web download and you only need to extract the archive and run the prometheus binary within. But if you install it that way you have to make a daemon script by your own.
Configuration
The configuration is done in an YAML file under /etc/prometheus/prometheus.yml which contains different sections:
-
globalscrape_interval: 15s # Set the scrape interval to every 15 seconds. Default is every 1 minute. evaluation_interval: 15s # Evaluate rules every 15 seconds. The default is every 1 minute. # scrape_timeout is set to the global default (10s).Scrape means the collection of metrics.
-
alerting -
rule_filesRecording rules can create precomputed results as new time series based on the metrics. Alerting rules define the conditions for an alert.
-
scrape_configsThis section controls what resources Prometheus monitors. Initially it contains only an entry to scrape its own metrics.
PromQL
The query language allows filtering and agregation based on the metric name and its labels.
Vector
You can query for a metric name or specific labels from it:
<metric name>{<label name>=<label value>, ...}
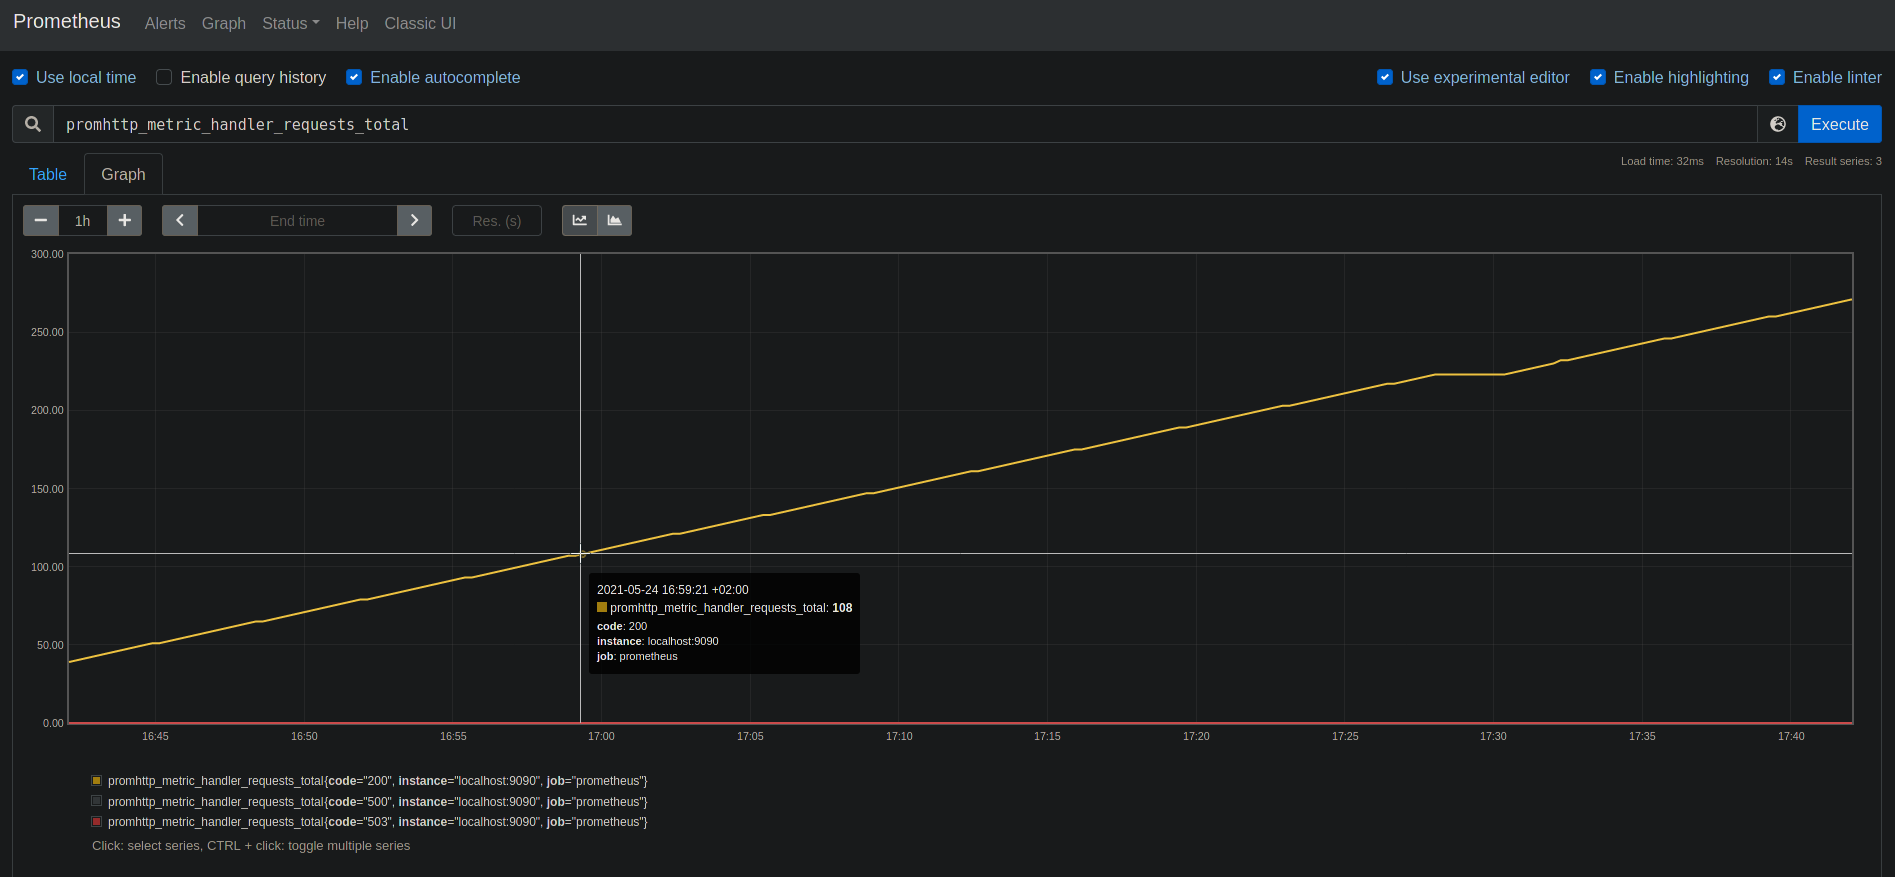
promhttp_metric_handler_requests_total
promhttp_metric_handler_requests_total{code="200"}
The label could not only be equal, but also:
= : Select labels that are exactly equal to the provided string.
!=: Select labels that are not equal to the provided string.
=~: Select labels that regex-match the provided string.
!~: Select labels that do not regex-match the provided string.
Subselection of the Vector based on a time duration using square brackets:
http_requests_total{job="prometheus"}[5m]
This will return all data from the last 5 minutes.
Offset modifier will return the values from the past:
http_requests_total offset 5m
@ modifier can get the value from a specific date (unix timestamp):
http_requests_total @ 1609746000
Operators
The following binary arithmetic operators exist in Prometheus:
+(addition)-(subtraction)*(multiplication)/(division)%(modulo)^(power/exponentiation)
The following binary comparison operators exist in Prometheus:
==(equal)!=(not-equal)>(greater-than)<(less-than)>=(greater-or-equal)<=(less-or-equal)
These logical/set binary operators are only defined between instant vectors:
and(intersection)or(union)unless(complement)
The ignoring keyword allows ignoring certain labels when matching, while the on keyword allows reducing the set of considered labels to a provided list.
Aggregation operators
sum(calculate sum over dimensions)min(select minimum over dimensions)max(select maximum over dimensions)avg(calculate the average over dimensions)group(all values in the resulting vector are 1)stddev(calculate population standard deviation over dimensions)stdvar(calculate population standard variance over dimensions)count(count number of elements in the vector)count_values(count number of elements with the same value)bottomk(smallest k elements by sample value)topk(largest k elements by sample value)quantile(calculate φ-quantile (0 ≤ φ ≤ 1) over dimensions)
Functions
abs()absent()absent_over_time()ceil()changes()clamp()clamp_max()clamp_min()day_of_month()day_of_week()days_in_month()delta()deriv()exp()floor()histogram_quantile()holt_winters()hour()idelta()increase()irate()label_join()label_replace()ln()log2()^log10()minute()month()predict_linear()rate()resets()round()scalar()sgn()sort()sort_desc()sqrt()time()timestamp()vector()year()<aggregation>_over_time()
Interfaces
Web Access
Prometheus is (by default) available on Port 9090.
CLI
This is done using promtool
API
The HTTP API is reachable on the prometheus server under /api/v1.
Instant query:
GET /api/v1/query?

query=<string>: Prometheus expression query string.
time=<rfc3339 | unix_timestamp>: Evaluation timestamp. Optional.
timeout=<duration>: Evaluation timeout. Optional. Defaults to and is capped by the value of the -query.timeout flag.
Range query:
GET /api/v1/query_range?

query=<string>: Prometheus expression query string.
start=<rfc3339 | unix_timestamp>: Start timestamp.
end=<rfc3339 | unix_timestamp>: End timestamp.
step=<duration | float>: Query resolution step width in duration format or float number of seconds.
timeout=<duration>: Evaluation timeout. Optional. Defaults to and is capped by the value of the -query.timeout flag.
Find time series:
GET /api/v1/series?

match[]=<series_selector>: Repeated series selector argument that selects the series to return. At least one match[] argument must be provided.
start=<rfc3339 | unix_timestamp>: Start timestamp.
end=<rfc3339 | unix_timestamp>: End timestamp.
Get label names:
GET /api/v1/labels?

start=<rfc3339 | unix_timestamp>: Start timestamp. Optional.
end=<rfc3339 | unix_timestamp>: End timestamp. Optional.
match[]=<series_selector>: Repeated series selector argument that selects the series from which to read the label names. Optional.
Get Label values:
GET /api/v1/label/<label_name>/values

start=<rfc3339 | unix_timestamp>: Start timestamp. Optional.
end=<rfc3339 | unix_timestamp>: End timestamp. Optional.
match[]=<series_selector>: Repeated series selector argument that selects the series from which to read the label values. Optional.